Постинг
29.06.2016 16:49 -
Maxima Minima — where art thou?


Maxima minima strategies offer good reward
Markets often enjoy strong Friday if below Monday's open
Strategy also opens up path to contrarian trades
First we need to realise that we are not concerned with ''luck'' but the randomness of events that we can benefit from. We shouldn't be concerned that the market has risen or fallen at any point in time as we can only react to real-time current price action(s).
In prior articles I have described the effects of multiple currency pairings against each other and for this article it might be better to look at individual fx pairings or indices.
First as Juliette cried out.. art thou? Where should we look and consider?
The safest trades are always (let me say again..), in the most liquid markets in which,you are assured, that no matter what the market does your order will be filled. Liquidity spirals are events that roll out of control — stops can be hit but not filled as there are no buyers present to complete the trade for you so you always seek a market place that has such a depth that there will always be someone to takeover the trade.
Consequently based on this one rule above we eliminate virtually all equities.
So what is left for us? Well the biggest index is SP500 and the surety of knowing that there are more trades being filled here than anywhere else gives credence to the market depth of buyers and sellers.
Additionally we see the real major indices are pretty much the same for depth... we should look at the major fx pairings. Don't be tempted by the more exotic pairings as ticket spreads can be horrifying to your trade and profit and loss account.
Romeo had that blasted balcony to consider before seeing his beloved Juliette and we as traders need to know just how high can the market climb just as Romeo looked to tackle that balcony.
What ever the marketplace you want to trade, you need to consider just how far the market moves in one direction intraday or daily or weekly. Likewise, what is the minimum move for intraday, daily or weekly? We could go further and see what is the maxima or minima for morning and afternoon or globex but lets keep things simple first.
Knowing the minimum wave range determines whether your trade has a chance of profiting... example SP500/emini ES# for intraday its 3.15pts so a scalper wants to gain 2pts on any breakout minimum. But the average is 8.45pts (5-yr average using hourlies) so if you see a low and the market turns as you expect, add 8.45pts to that low as an indication of a move before the market hesitates. It may continue the move but opening the trade at 5pts from the low suggests resistance may occur and hold your trade back.
Days of the week present issues for us traders too. Consider Fridays. If there is to be a recovery day then Friday will have the greatest weighting. A weekly price that looks to below Monday's open will usually see an attempt at recovering on a Friday.
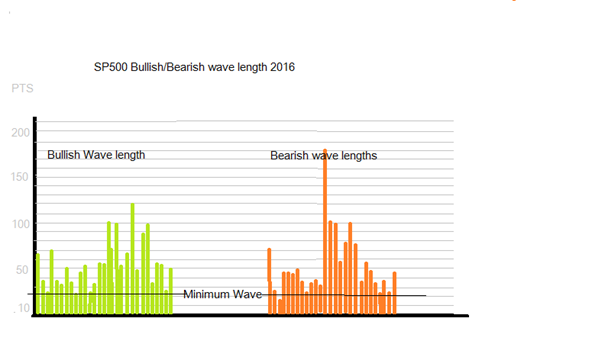
Certainly 2016 has been a wild ride for traders on SP500 so lets refine the wave extensions that we have seen to date the chart appears messy but on closer examination for the daily upward trends, we see a consistent minimum move of 21pts measuring low to high so the minimum profit expectation within this 21pt measure. If you enter a trade long say 5pts from the wave low then your minimum profit expectation is 16pts. (eg 5pts +16pts = 21pts minimum wave).
However the same chart also highlights band levels for wave extensions....
For bullish moves (daily) we see the following confluence of wave size:
21pts
32-35pts
43-45pts
52pts
Anything greater implies a rapid run-away train scenario which you should trail your stops tighter. For 2016 we have 29 bullish wave counts and literally all equal or exceed 21pts from low to high.
Looking at the bearish side of the chart we see other scenarios.
There was one minor instance of a 13pt drop, that is the wave high down to wave low. The other 26 instances have a minimum 21pts range so once again probabilities are high towards a minimum 21 pts trading range.
If we have a willingness for risk then we see the bulk (19 instances) of 32pts+ trading range or to put it another way a 50% increase of potential profit for a very slight drop in probability of success. At one point the bearish wave length reached an astonishing 180pts.
When the market drops we see a break of 54pts trade range and the market will gain momentum and extend to the following ranges (typically);
70-76pts
100-102pts
180pts
I'm not sure if the above is of use to anyone but I am able to provide for the following; cable/eurusd/usdyen/usdcad/ftse/dax for dailies and intraday. The point of the article is to show current extension levels where the market starts to hesitate and stall regardless of directional trend there are patterns.
Remember once you know where the stalling points of any move typically occur, then a contrarian trade can be considered.
цитирайMarkets often enjoy strong Friday if below Monday's open
Strategy also opens up path to contrarian trades
First we need to realise that we are not concerned with ''luck'' but the randomness of events that we can benefit from. We shouldn't be concerned that the market has risen or fallen at any point in time as we can only react to real-time current price action(s).
In prior articles I have described the effects of multiple currency pairings against each other and for this article it might be better to look at individual fx pairings or indices.
First as Juliette cried out.. art thou? Where should we look and consider?
The safest trades are always (let me say again..), in the most liquid markets in which,you are assured, that no matter what the market does your order will be filled. Liquidity spirals are events that roll out of control — stops can be hit but not filled as there are no buyers present to complete the trade for you so you always seek a market place that has such a depth that there will always be someone to takeover the trade.
Consequently based on this one rule above we eliminate virtually all equities.
So what is left for us? Well the biggest index is SP500 and the surety of knowing that there are more trades being filled here than anywhere else gives credence to the market depth of buyers and sellers.
Additionally we see the real major indices are pretty much the same for depth... we should look at the major fx pairings. Don't be tempted by the more exotic pairings as ticket spreads can be horrifying to your trade and profit and loss account.
Romeo had that blasted balcony to consider before seeing his beloved Juliette and we as traders need to know just how high can the market climb just as Romeo looked to tackle that balcony.
What ever the marketplace you want to trade, you need to consider just how far the market moves in one direction intraday or daily or weekly. Likewise, what is the minimum move for intraday, daily or weekly? We could go further and see what is the maxima or minima for morning and afternoon or globex but lets keep things simple first.
Knowing the minimum wave range determines whether your trade has a chance of profiting... example SP500/emini ES# for intraday its 3.15pts so a scalper wants to gain 2pts on any breakout minimum. But the average is 8.45pts (5-yr average using hourlies) so if you see a low and the market turns as you expect, add 8.45pts to that low as an indication of a move before the market hesitates. It may continue the move but opening the trade at 5pts from the low suggests resistance may occur and hold your trade back.
Days of the week present issues for us traders too. Consider Fridays. If there is to be a recovery day then Friday will have the greatest weighting. A weekly price that looks to below Monday's open will usually see an attempt at recovering on a Friday.
Certainly 2016 has been a wild ride for traders on SP500 so lets refine the wave extensions that we have seen to date the chart appears messy but on closer examination for the daily upward trends, we see a consistent minimum move of 21pts measuring low to high so the minimum profit expectation within this 21pt measure. If you enter a trade long say 5pts from the wave low then your minimum profit expectation is 16pts. (eg 5pts +16pts = 21pts minimum wave).
However the same chart also highlights band levels for wave extensions....
For bullish moves (daily) we see the following confluence of wave size:
21pts
32-35pts
43-45pts
52pts
Anything greater implies a rapid run-away train scenario which you should trail your stops tighter. For 2016 we have 29 bullish wave counts and literally all equal or exceed 21pts from low to high.
Looking at the bearish side of the chart we see other scenarios.
There was one minor instance of a 13pt drop, that is the wave high down to wave low. The other 26 instances have a minimum 21pts range so once again probabilities are high towards a minimum 21 pts trading range.
If we have a willingness for risk then we see the bulk (19 instances) of 32pts+ trading range or to put it another way a 50% increase of potential profit for a very slight drop in probability of success. At one point the bearish wave length reached an astonishing 180pts.
When the market drops we see a break of 54pts trade range and the market will gain momentum and extend to the following ranges (typically);
70-76pts
100-102pts
180pts
I'm not sure if the above is of use to anyone but I am able to provide for the following; cable/eurusd/usdyen/usdcad/ftse/dax for dailies and intraday. The point of the article is to show current extension levels where the market starts to hesitate and stall regardless of directional trend there are patterns.
Remember once you know where the stalling points of any move typically occur, then a contrarian trade can be considered.